

Private Credit Investing: Market Outlook, Risks, Opportunities, and What Investors Should Know
A war in Iran sent oil prices surging. The S&P 500 fell more than 4%. And the $3.5 trillion private credit industry hit its first real stress test—with $13 billion in redemption requests exposing a structural liquidity mismatch that has been building for years.
If you’re an investor trying to make sense of what just happened, and more importantly, what it means for your portfolio, this report breaks it down.
Geopolitical Shock Reshapes Global Markets
The conflict in Iran was the real defining story of Q1. The escalation of events during the last week in February injected new uncertainty into global markets. The onset of the Iran war led to a dramatic surge in oil prices which then led to falling stock prices and rising bond yields. As the conflict raged on, Iran retaliated by blocking the Straits of Hormuz; effectively choking off Gulf shipping routes. Increased tensions heightened the risk to energy infrastructure and created greater uncertainty around global supply chains.
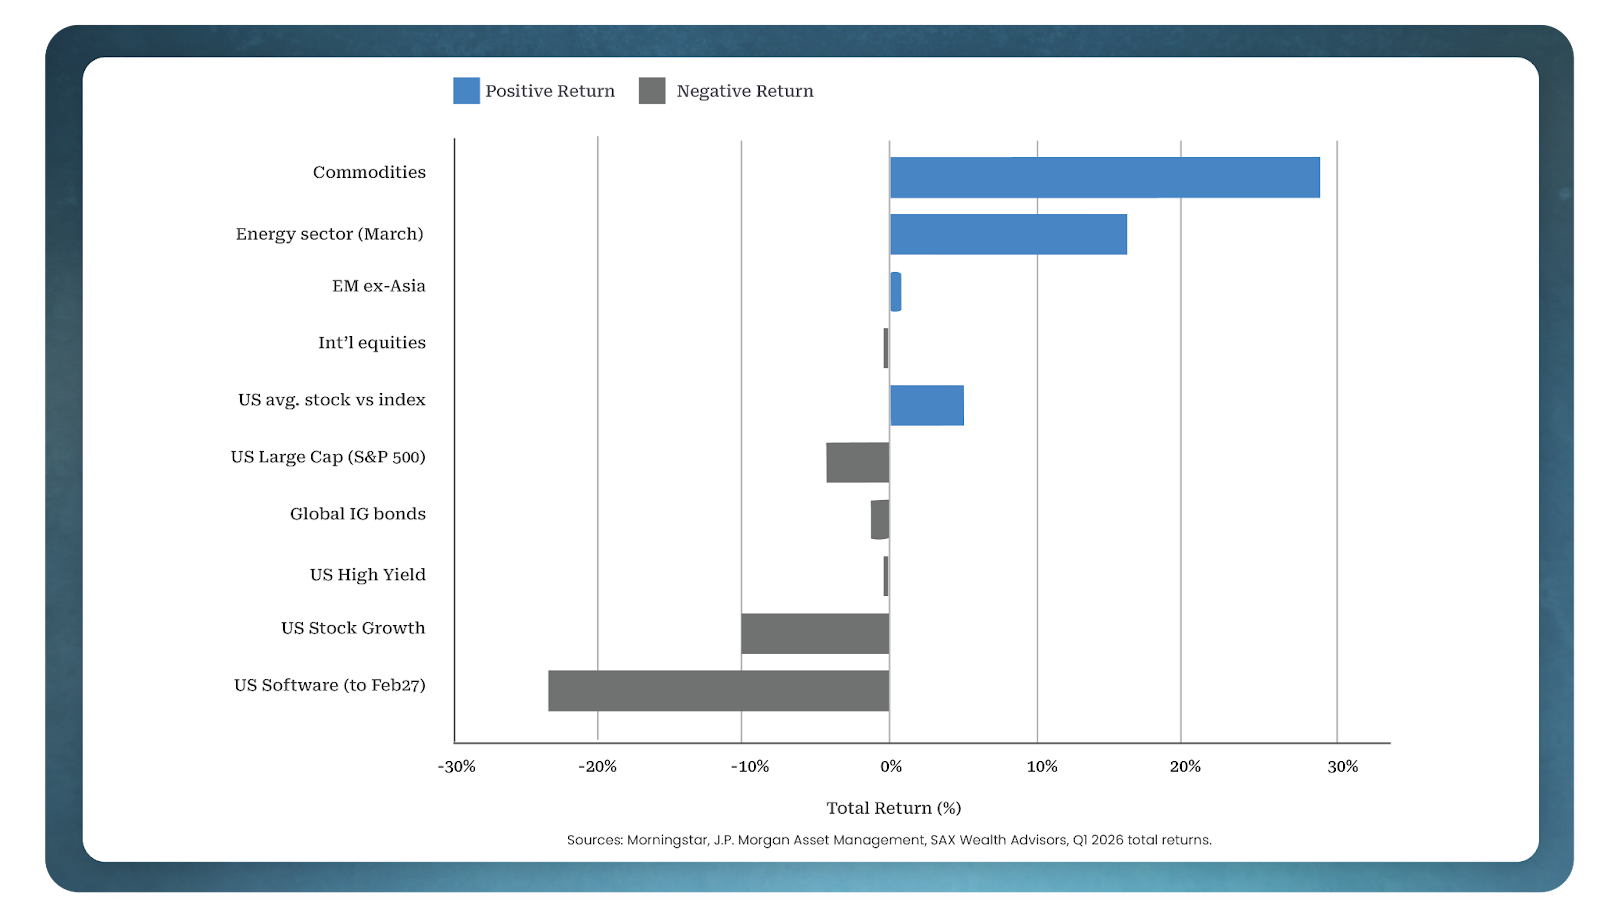
The price of oil rose more than 70% in Q1, with crude trading at its highest level since mid-2022. The average price of a gallon of gasoline rose nearly $1.00 since late February. Investors concentrated entirely in equities absorbed the full impact of the uncertainty. Those with exposure to commodities and uncorrelated private market investments experienced a very different quarter.
Equity Markets React to Rising Uncertainty
The S&P 500 was down more than 4% in the first quarter. Tech stocks had a particularly challenging start as investors grew concerned that new AI capabilities would threaten the software-as-a-service (SaaS) model, with US software stocks declining 23% from the beginning of the year through February 27th. Commodities, conversely, were the clear year-to-date leader, posting a +29% return and gaining +16% in March alone, driven by the surge in energy prices.
Fixed Income & The Fed Policy Remain Uncertain
The Fed held rates steady at 3.50%–3.75% at both its January and March meetings. After delivering three consecutive 25-basis-point cuts in late 2025, the FOMC adopted a “wait and see” approach. Market pricing shifted to expecting the Fed to stay on hold for the remainder of the year, with a small but notable chance of a rate hike beginning to build.
In credit markets, spreads widened across both high yield and investment grade bonds. The US high yield market (-0.5%) outperformed its European equivalent (-1.7%), and global investment grade bonds returned -1.3% in the first quarter.
As traditional fixed income continues to face pressure from rate uncertainty and widening spreads, many investors are increasingly exploring alternative income strategies that offer more predictable returns and asset-backed exposure.
Private Credit Investing: A Stress Test for the Asset Class
While the Iran conflict drove the biggest macro headlines, the fastest-moving story in private markets was the storm building inside private credit. Three forces collided in Q1—deteriorating loan quality, a wave of redemption requests, and AI-driven sector anxiety—producing the asset class’s first genuine stress test.
Private credit grew to $3.5 trillion by doing what banks stopped doing after 2008: lending money to riskier companies, charging higher interest, and telling investors they could withdraw quarterly. Now the money is trying to leave, and there’s a limited exit. The Financial Times reported $13 billion in withdrawal requests across more than a dozen funds in Q1 alone, with over $4.6 billion of investor capital now trapped behind withdrawal limits.
The numbers at the individual fund level are striking. Carlyle’s $7 billion Tactical Private Credit Fund reported redemption requests totaling 16% of its shares during Q1 — the third highest in the industry — behind Blue Owl Technology Income at 41% and Blue Owl Credit Income at 22%.
Despite the surge, Carlyle fulfilled only a portion of investor requests, capping withdrawals at 5%, paying out roughly $240 million against the nearly $750 million investors sought to redeem. Other major firms, including Apollo, Ares, Morgan Stanley, and BlackRock, also introduced similar limits on withdrawals. Apollo Debt Solutions saw redemption requests reach 11.2% in Q1. Goldman Sachs Private Credit Corp., the firm’s roughly $15.7 billion non-traded BDC, met redemption requests totaling 4.999% of outstanding shares in Q1 — effectively right up against the standard 5% quarterly limit.
The average redemption request across larger non-traded BDCs was running at about 15%, three times the quarterly cap. The industry promised 5% quarterly liquidity. Investors want 15%. The math doesn’t work.

The Core Problem: Liquidity Mismatch
The systemic risk in private credit was never inside the funds themselves — it’s in the plumbing around them: the bank credit lines, the insurance balance sheets, the retail wrappers, and the opacity that ties them together. The industry built a $3 trillion structure and then promised retail investors quarterly liquidity at par. One can argue that the real problem was one of expectations; retail investors thinking that these funds operated in the same way that mutual funds do.
A lot of the recent concerns have been concentrated around business development corporations (BDCs), illiquid real estate investment trusts, and insurance-backed vehicles. All of these have the same liquidity challenges when sentiment falls — i.e., redemptions — and some have higher credit risk.
Rising Risks in Private Credit: Exposure and Defaults
A major driver of investor anxiety is private credit’s significant exposure to software and SaaS businesses — precisely the sector most threatened by the AI disruption narrative that roiled public markets in Q1. Attention has shifted sharply to software exposure in direct lending — estimated at around 26% of portfolios according to Morgan Stanley — after fears that agentic AI could disrupt the SaaS model sent publicly-listed SaaS stocks plunging. Software is the largest sector in the Apollo Debt Solutions BDC at more than 12%, and Blue Owl is also heavily exposed to SaaS lending. Blackstone’s flagship private credit fund BCRED, which also saw a surge in redemption requests in Q1, was down 0.4% in February — its first monthly loss in three years.
While the headline default rate in private credit has remained below 2% for several years, once selective defaults and liability management exercises are taken into account, the “true” default rate approaches 5%. Morgan Stanley recently warned that default rates in private credit direct lending could surge to 8%, well above the 2–2.5% historical average, with pressure concentrated in sectors vulnerable to AI disruption such as software.
However, Morgan Stanley analysts also noted that an 8% default spike would be “significant but not systemic,” pointing to lower leverage among private credit funds and BDCs compared with 2008. One Raymond James executive described it as taking private credit “from a ‘zero loss’ fantasy to a more normal credit asset class — painful in spots, but ultimately a healthy reset that frees up capital for stronger businesses.”
Is Private Credit Still a Good Investment?
Despite very prominent voices in financial markets sounding the alarm that private credit investing could be the cause of the next financial crisis, it is important not to lose sight of the counterargument, which serious analysts have also made clearly. The current struggles in public asset managers are not an indication that the private credit asset class is broken. Managers in the truly illiquid private credit space do not have the same volatility challenges.
Private credit as an alternative asset class has historically proven to be a good long-term investment when the appropriate due diligence is conducted. Private credit funds are also generally less leveraged today than the investment banks caught up in the 2008 crash. Most private credit capital remains in traditional closed-end structures backed by institutional investors with long-term investment horizons. The current stress is concentrated in the semi-liquid retail-facing wrappers — BDCs, interval funds, and non-traded vehicles — that were the growth channel of the last five years.
For investors, this highlights an important distinction within private credit investing. Not all structures carry the same liquidity risk. Some private market investments are designed with defined durations and clearer exit timelines, which can help reduce the mismatch between investor expectations and underlying assets.
What Investors Should Watch in 2026
Despite the noise, the underlying economy has more tailwinds than headwinds as we move deeper into 2026. Trade war uncertainty is fading as tariff policy stabilizes, and a historic capital expenditure boom is underway in AI infrastructure, with hyperscalers and cloud providers committing hundreds of billions to capacity building.
Something to remember – the S&P 500 has consistently recovered from geopolitical shocks, with markets tending to look through conflict once corporate fundamentals reassert themselves. For private market investors specifically, the key watchpoints heading into Q2 are the trajectory of oil prices and any ceasefire; the resolution (or escalation) of the private credit redemption crisis and default cycle; the pace of PE exit activity as a precondition for fundraising recovery; and the Gulf shipping disruption’s second-order effects on supply chain-exposed portfolio companies.
For individual investors, this environment reinforces the importance of diversification beyond traditional stocks and bonds. Private market investments, particularly those with shorter durations and asset-backed structures, are becoming an increasingly important part of modern portfolio construction.
Q1 of 2026 was volatile. Investors who came through with confidence were the ones who didn’t need any single prediction to be “right.”
If you’re looking for diversification, higher yields, and exposure to private credit investing and private markets, take a look at how Groundfloor’s real estate-backed, fixed-rate Notes compare to traditional and alternative fixed income products.
Sources: Uploaded document (S&P Global Market Intelligence, TIAA Wealth Management Q1 2026 Chartbook, LPL Research/CFA Institute), Morningstar, J.P. Morgan Asset Management, McKinsey Global Private Markets Report 2026, BlackRock, BBH Capital Partners, Within Intelligence, Cerity Partners, CNBC, Financial Times, Wall Street Journal, Goldman Sachs/Ayco, Verdence Capital Advisors, Sage Advisory, and others.